Contents
0.引言
看过李永乐老师的视频 淘宝“双11”2684亿销售额造假了吗?用本福特定律检验一下, 用本福特定律检验下:
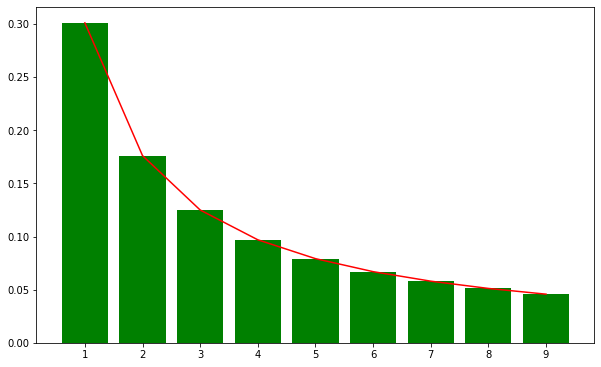
1.构建本福特柱状图
from math import log10
import matplotlib
import matplotlib.pyplot as plt
import numpy as np


def benford(n):
    return log10(n+1) - log10(n)

results = [benford(i) for i in range(1, 10)]
index = np.arange(1, 10)

plt.figure(figsize=(10, 6.18))
plt.bar(index,results, color='g')
plt.plot(index, results, 'r')
plt.xticks(index, index)
plt.show()

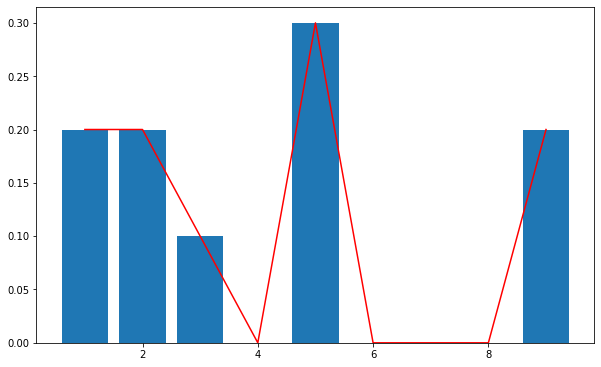
2.构建历年销售额的柱状图
# data, unit: ten million RMB
sales_by_year = {"2009":"5.0",
         "2010":"93.6",
         "2011":"520",
         "2012":"1910",
         "2013":"3500",
         "2014":"5710",
         "2015":"9120",
         "2016":"12070",
         "2018":"21350",
         "2019":"26840"}
count = {}

for k, v in sales_by_year.items():
    idx = v[0]
    if idx not in count:
        count[idx] = 1
    else:
        count[idx] += 1

count = {k:v/10 for k, v in count.items()}

sales = [0 for i in range(9)]

for k, v in count.items():
    sales[int(k)-1] = v

plt.figure(figsize=(10, 6.18))
plt.plot(index, sales, color='r')
plt.bar(index, sales)

3.Qualitive Analysis: Take a view by setting them side by side
fig = plt.figure(figsize=(20, 6.18))

ax1 = fig.add_subplot(1, 2, 1)
ax2 = fig.add_subplot(1, 2, 2)


def benford(n):
    return log10(n+1) - log10(n)

results = [benford(i) for i in range(1, 10)]
ax1.bar(list(range(1,10)), results)

# create benford bar graph
index = np.arange(1, 10)
ax1.bar(index, results)
ax1.plot(index, results, color='r')

ax2.bar(index, sales)
ax2.plot(index, sales, color='r')
plt.show()

4.Quantitative Analysis
从图表上直观看, 匹配度不高, 那么匹配的具体数值是多少呢?
import numpy as np
from scipy import stats

benford_seq = np.log10(1 + 1/np.arange(1, 10))
counts = [2, 2, 1, 0, 3, 0, 0, 0, 2]

stats.chisquare(counts, benford_seq*sum(counts))
Power_divergenceResult(statistic=14.508778904402215, pvalue=0.06943079701067742)
匹配度为6.94%.
5.Publish
import subprocess
cmd = "pandoc --wrap=none benford_law.org -o ~/Public/nikola_post/posts/淘宝销售额造假了吗.rst"
subprocess.run(cmd, shell=True)
cd  ~/Documents/OrgMode/ORG/images
ls -t  | head -n 4 | while read line; do cp $line     ~/Public/nikola_post/images/; done